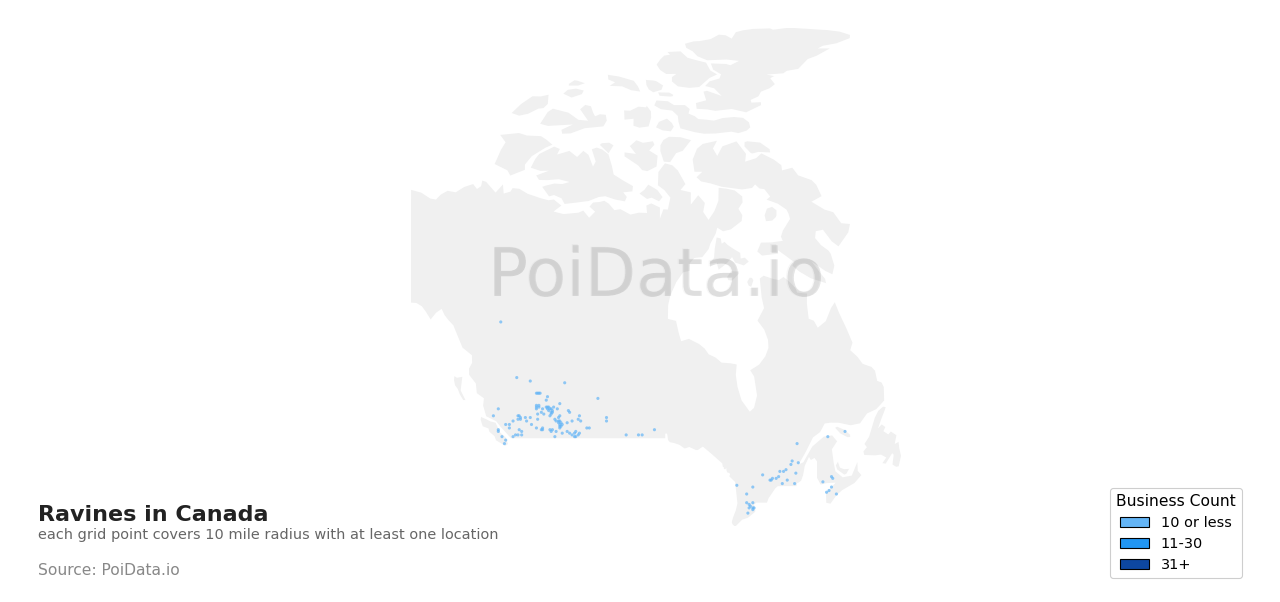
How many Ravines are there in Canada?
There are 181 Ravines in Canada as of April, 2026. The highest number of Ravines of Canada are in Alberta and British Columbia with 51 businesses and 50 businesses, respectively. Alberta makes up approximately 28.2% of all Ravines in the Canada.
Sample Data
Preview of Ravine businesses in Canada
| Business Name | City | Rating | Reviews | Phone | Website | Latitude | Longitude |
|---|---|---|---|---|---|---|---|
|
Barron Canyon
|
Unorganized South Nipissing District
|
★
4.0
|
108
|
Not available | algonquinpark.on.ca |
**.****
|
**.****
|
|
Coaticook Gorge
|
Coaticook
|
★
4.0
|
93
|
Not available | Not available |
**.****
|
**.****
|
|
Annapolis Valley
|
Annapolis County
|
★
4.0
|
59
|
Not available | Not available |
**.****
|
**.****
|
|
Marble Canyon (Briti...
|
Thompson-Nicola
|
★
4.0
|
28
|
Not available | Not available |
**.****
|
**.****
|
|
Valley of the Ten Pe...
|
Improvement District No. 9
|
★
4.0
|
26
|
Not available | Not available |
**.****
|
**.****
|
|
Sundance Canyon
|
Improvement District No. 9
|
★
5.0
|
11
|
Not available | Not available |
**.****
|
**.****
|
|
Kennedale Ravine
|
Edmonton
|
★
4.0
|
10
|
Not available | Not available |
**.****
|
**.****
|
|
Callaghan Valley
|
Squamish-Lillooet
|
★
4.0
|
8
|
Not available | Not available |
**.****
|
**.****
|
|
Dundas Valley
|
Hamilton
|
★
4.0
|
7
|
Not available | Not available |
**.****
|
**.****
|
|
Slocan Valley
|
Central Kootenay
|
★
5.0
|
5
|
Not available | Not available |
**.****
|
**.****
|
Get access to all 171 remaining Ravines with complete contact information, addresses, and business details.
Get Complete List (181 Businesses)Top States
Highest concentration of Ravines
| State | Business Count | Percentage |
|---|---|---|
| Alberta |
51
|
28.2%
|
| British Columbia |
50
|
27.6%
|
| Ontario |
15
|
8.3%
|
| Quebec |
14
|
7.7%
|
| Saskatchewan |
6
|
3.3%
|
| Nova Scotia |
5
|
2.8%
|
| Manitoba |
4
|
2.2%
|
| New Brunswick |
3
|
1.7%
|
Top Cities
Cities with most Ravines
| City | Business Count | Percentage |
|---|---|---|
|
Columbia-Shuswap
|
9
|
5%
|
|
East Kootenay
|
7
|
3.9%
|
|
Forty Mile County No. 8
|
6
|
3.3%
|
|
Improvement District No. 9
|
6
|
3.3%
|
|
Ranchland No. 66
|
6
|
3.3%
|
|
Central Kootenay
|
6
|
3.3%
|
|
Thompson-Nicola
|
5
|
2.8%
|
|
Cardston County
|
4
|
2.2%
|
|
Willow Creek No. 26
|
4
|
2.2%
|
|
Fraser Valley
|
4
|
2.2%
|
|
Squamish-Lillooet
|
4
|
2.2%
|
|
Foothills County
|
3
|
1.7%
|
|
Improvement District No. 12
|
3
|
1.7%
|
|
Annapolis County
|
3
|
1.7%
|
|
Clearwater County
|
2
|
1.1%
|
|
Cypress County
|
2
|
1.1%
|
|
Kananaskis
|
2
|
1.1%
|
|
Newell County No. 4
|
2
|
1.1%
|
|
Pincher Creek No. 9
|
2
|
1.1%
|
|
Warner County No. 5
|
2
|
1.1%
|
|
Comox Valley
|
2
|
1.1%
|
|
Cowichan Valley
|
2
|
1.1%
|
|
Burlington
|
2
|
1.1%
|
|
Grey Highlands
|
2
|
1.1%
|
|
Ottawa
|
2
|
1.1%
|
|
Mont-Saint-Hilaire
|
2
|
1.1%
|
|
Central Kootenay
|
1
|
0.6%
|
|
Bighorn No. 8
|
1
|
0.6%
|
|
Edmonton
|
1
|
0.6%
|
|
Improvement District No. 25
|
1
|
0.6%
|
|
Jasper
|
1
|
0.6%
|
|
Special Area No. 3
|
1
|
0.6%
|
|
Vulcan County
|
1
|
0.6%
|
|
Alberni-Clayoquot
|
1
|
0.6%
|
|
Capital Regional District
|
1
|
0.6%
|
|
Cariboo
|
1
|
0.6%
|
|
Fraser-Fort George
|
1
|
0.6%
|
|
Kamloops
|
1
|
0.6%
|
|
Kent
|
1
|
0.6%
|
|
Langford
|
1
|
0.6%
|
|
Mount Waddington A
|
1
|
0.6%
|
|
North Okanagan
|
1
|
0.6%
|
|
Northern Rockies B
|
1
|
0.6%
|
|
Sunshine Coast Regional District
|
1
|
0.6%
|
|
Argyle
|
1
|
0.6%
|
|
Morton
|
1
|
0.6%
|
|
Rhineland
|
1
|
0.6%
|
|
Ritchot
|
1
|
0.6%
|
|
Alma Parish
|
1
|
0.6%
|
|
Pennfield Parish
|
1
|
0.6%
|
What Data Do We Provide?
Our list for Ravines in Canada is one of the most comprehensive in the industry. As of May, 2026, we have compiled data on 181 verified listings.
Essential Business Details
Complete business name, full address, and operational hours for all 181 Ravines
Contact Information
Direct phone numbers, email addresses, and website URLs for Ravines across Canada
Customer Engagement Metrics
Average ratings, total review counts, and customer feedback data from Ravines in Canada
Precise Geolocation Data
Exact latitude/longitude coordinates and regional distribution across 8 states in Canada
Complete Data Fields for Ravines in Canada:
Each of the 181 Ravines records includes:
Business Attributes
Common features and services (10+ businesses)
How You Can Use Ravines Data from Canada
Our comprehensive list of 181 Ravines in Canada empowers you to reach the right audience through multiple channels. Here are key ways this data can give you a competitive edge in the Ravines industry.
Geospatial Analysis & Hotspot Detection
Perform advanced spatial analysis to identify business clusters, service gaps, and market saturation patterns across 8 states in Canada using precise coordinate data from 181 Ravines.
Market Research & Competitive Analysis
Analyze trends, saturation, and competitor presence across 8 states in Canada to uncover underserved areas and high-potential markets for Ravines.
Lead Generation & Sales Prospecting
Find and reach Ravines in Canada using verified phone numbers, websites, and category filters for smarter, targeted prospecting.
Location Intelligence & Expansion Planning
Plan new Ravines openings or rollouts using density maps and insights from our 181 listings to target low-competition, high-demand zones in Canada.
AI & NLP Model Training
Train machine learning models with structured data and real user reviews from 181 Ravines for improved sentiment analysis and recommendation systems.
Real Estate & Investment Insights
Evaluate commercial potential in Canada by analyzing the distribution of Ravines across 50 cities and their activity trends.
Email Marketing Campaigns
Run targeted email campaigns to Ravines in Canada using verified email addresses for personalized outreach and improved conversion rates.
Cold Calling & Telemarketing
Use up-to-date phone numbers from our 181 Ravines database to initiate effective conversations and improve call conversion rates.
Direct Mail Marketing
Send promotional materials to Ravines across Canada using accurate mailing addresses for targeted delivery and higher response rates.
Social Media Outreach
Engage Ravines in Canada via Instagram, LinkedIn, or Facebook using curated profile data for multi-channel marketing.
Footfall & Demand Estimation
Estimate local foot traffic and demand by analyzing the concentration of Ravines in specific regions of Canada and their popularity metrics.
Local SEO & Digital Services
Optimize marketing strategies for Ravines by studying GMB listings, ratings, and categories used by top-performing competitors in Canada.
Mapping & Navigation Integration
Add Ravines POI data to your apps for delivery, logistics, or travel using accurate coordinates from 181 verified locations in Canada.
Ravine in Other Countries
Explore Ravines data across major markets worldwide
How can I download a list of Ravines in Canada into Excel?
You can download the complete list of 181 Ravines data as an Excel file, along with geo-coded addresses, phone numbers and open hours by contacting our sales team.