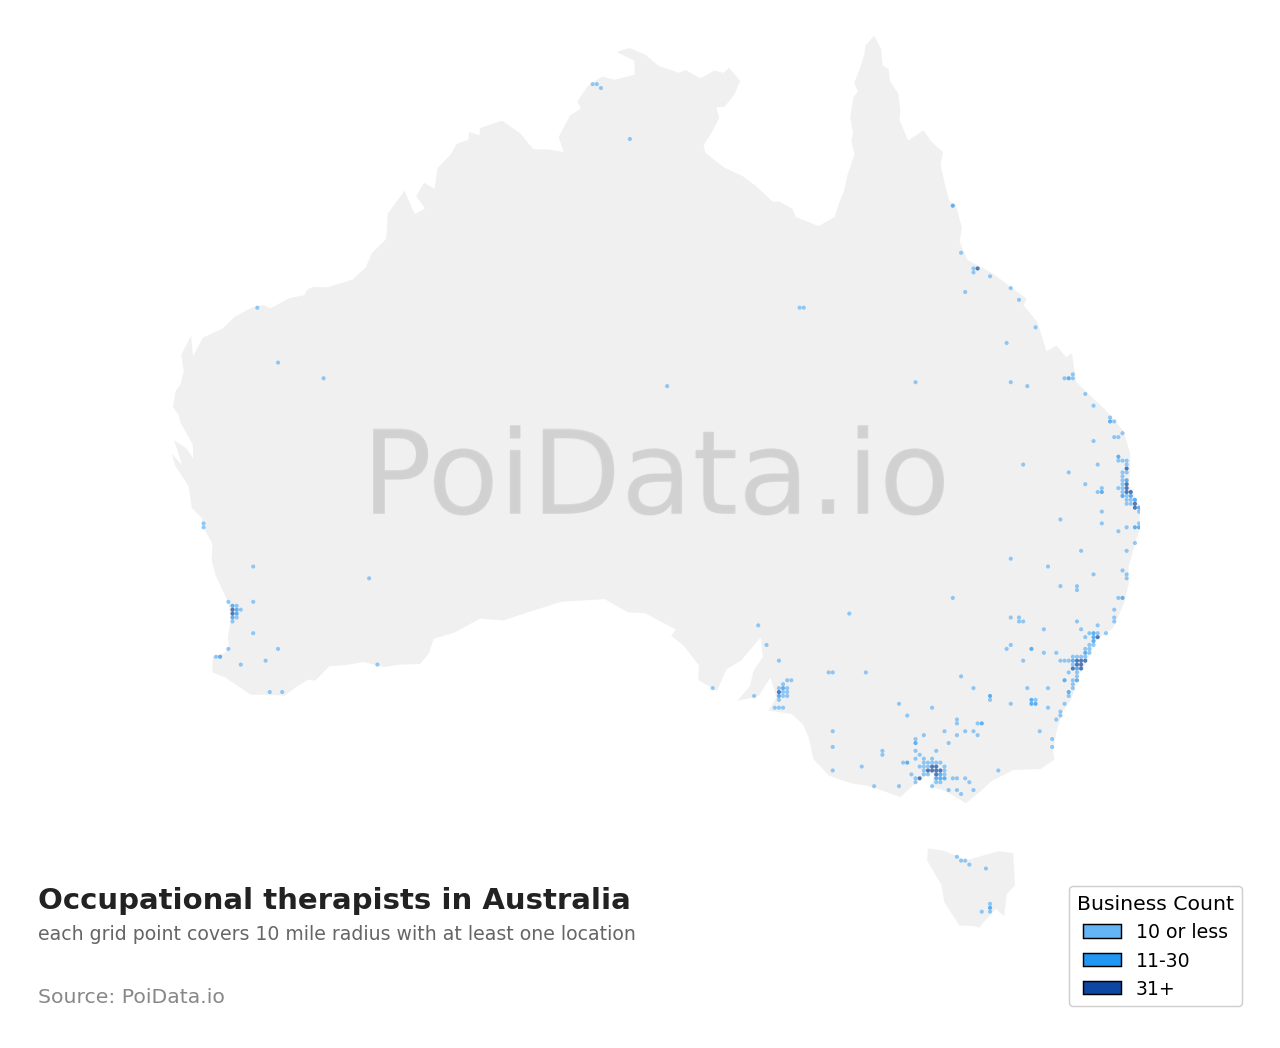
List of Occupational therapists in Australia?
There are 3,126 Occupational therapists in Australia as of February, 2026. The highest number of Occupational therapists of Australia are in New South Wales and Queensland with 800 businesses and 654 businesses, respectively. New South Wales makes up approximately 25.6% of all Occupational therapists in the Australia.
Sample Data
Preview of Occupational therapist businesses in Australia
| Business Name | City | Rating | Reviews | Phone | Website | Latitude | Longitude |
|---|---|---|---|---|---|---|---|
|
St George Hospital
|
Kogarah
|
★
3.0
|
581
|
(*2) *1*3 *1*1 | seslhd.health.nsw.go... |
**.****
|
**.****
|
|
Activ Therapy Liverp...
|
Liverpool
|
★
4.0
|
219
|
(*2) *7*6 *4*1 | activtherapy.com.au |
**.****
|
**.****
|
|
High Performance Hea...
|
Wetherill Park
|
★
5.0
|
181
|
(*2) *3*8 *5*1 | hpha.com.au |
**.****
|
**.****
|
|
Medical One
|
Morphett Vale
|
★
2.0
|
152
|
(*8) *1*6 *1*1 | medicalone.com.au |
**.****
|
**.****
|
|
RediMed Belmont
|
Belmont
|
★
3.0
|
149
|
*3*0 *0* 3*4 | redimed.com.au |
**.****
|
**.****
|
|
Complete Allied Heal...
|
Canley Heights
|
★
4.0
|
141
|
(*2) *0*0 *7*0 | completeahc.com.au |
**.****
|
**.****
|
|
Leppington Allied He...
|
Leppington
|
★
5.0
|
140
|
(*2) *0*6 *1*5 | leppingtonalliedheal... |
**.****
|
**.****
|
|
Stirling Health Prof...
|
Stirling
|
★
4.0
|
136
|
(*8) *4*6 *3*2 | stirlinghealthprofes... |
**.****
|
**.****
|
|
ProMelius
|
Scarness
|
★
5.0
|
114
|
*4*1 *6* 7*9 | promelius.com.au |
**.****
|
**.****
|
|
Activ Therapy Chippi...
|
Chipping Norton
|
★
4.0
|
113
|
(*2) *7*6 *4*1 | activtherapy.com.au |
**.****
|
**.****
|
Get access to all 3,116 remaining Occupational therapists with complete contact information, addresses, and business details.
Get Complete List (3,126 Businesses)Top States
Highest concentration of Occupational therapists
| State | Business Count | Percentage |
|---|---|---|
| New South Wales |
800
|
25.6%
|
| Queensland |
654
|
20.9%
|
| Victoria |
580
|
18.6%
|
| Western Australia |
309
|
9.9%
|
| South Australia |
156
|
5%
|
| NSW |
47
|
1.5%
|
| Tasmania |
34
|
1.1%
|
| QLD |
30
|
1%
|
| Australian Capital Territory |
27
|
0.9%
|
| VIC |
16
|
0.5%
|
| Northern Territory |
12
|
0.4%
|
| TAS |
4
|
0.1%
|
| ACT |
2
|
0.1%
|
Top Cities
Cities with most Occupational therapists
| City | Business Count | Percentage |
|---|---|---|
|
Maroochydore
|
15
|
0.5%
|
|
Buderim
|
14
|
0.4%
|
|
North Lakes
|
14
|
0.4%
|
|
Campbelltown
|
13
|
0.4%
|
|
Orange
|
12
|
0.4%
|
|
Port Macquarie
|
12
|
0.4%
|
|
Robina
|
12
|
0.4%
|
|
Toowoomba City
|
12
|
0.4%
|
|
Werribee
|
12
|
0.4%
|
|
Albury
|
11
|
0.4%
|
|
Bella Vista
|
11
|
0.4%
|
|
Adelaide
|
11
|
0.4%
|
|
Bendigo
|
11
|
0.4%
|
|
Miranda
|
10
|
0.3%
|
|
Penrith
|
10
|
0.3%
|
|
Frankston
|
10
|
0.3%
|
|
Coffs Harbour
|
9
|
0.3%
|
|
Sydney
|
9
|
0.3%
|
|
Tamworth
|
9
|
0.3%
|
|
Gympie
|
9
|
0.3%
|
|
Bundoora
|
9
|
0.3%
|
|
South Morang
|
9
|
0.3%
|
|
Joondalup
|
9
|
0.3%
|
|
Mandurah
|
9
|
0.3%
|
|
Subiaco
|
9
|
0.3%
|
|
Ballina
|
8
|
0.3%
|
|
Caringbah
|
8
|
0.3%
|
|
Maitland
|
8
|
0.3%
|
|
Wagga Wagga
|
8
|
0.3%
|
|
Wollongong
|
8
|
0.3%
|
|
Southport
|
8
|
0.3%
|
|
Woolloongabba
|
8
|
0.3%
|
|
Ballarat Central
|
8
|
0.3%
|
|
Geelong
|
8
|
0.3%
|
|
Newtown
|
8
|
0.3%
|
|
Richmond
|
8
|
0.3%
|
|
Osborne Park
|
8
|
0.3%
|
|
Bankstown
|
7
|
0.2%
|
|
Blacktown
|
7
|
0.2%
|
|
Cardiff
|
7
|
0.2%
|
|
Norwest
|
7
|
0.2%
|
|
Nowra
|
7
|
0.2%
|
|
Parramatta
|
7
|
0.2%
|
|
Burleigh Heads
|
7
|
0.2%
|
|
Nambour
|
7
|
0.2%
|
|
Rockhampton City
|
7
|
0.2%
|
|
Croydon
|
7
|
0.2%
|
|
Hawthorn East
|
7
|
0.2%
|
|
Melbourne
|
7
|
0.2%
|
|
Nedlands
|
7
|
0.2%
|
What Data Do We Provide?
Our list for Occupational therapists in Australia is one of the most comprehensive in the industry. As of March, 2026, we have compiled data on 3,126 verified listings.
Essential Business Details
Complete business name, full address, and operational hours for all 3,126 Occupational therapists
Contact Information
Direct phone numbers, email addresses, and website URLs for Occupational therapists across Australia
Customer Engagement Metrics
Average ratings, total review counts, and customer feedback data from Occupational therapists in Australia
Precise Geolocation Data
Exact latitude/longitude coordinates and regional distribution across 16 states in Australia
Complete Data Fields for Occupational therapists in Australia:
Each of the 3,126 Occupational therapists records includes:
Business Attributes
Common features and services (10+ businesses)
payment methods
services
amenities
accessibility
business type
other
How You Can Use Occupational therapists Data from Australia
Our comprehensive list of 3,126 Occupational therapists in Australia empowers you to reach the right audience through multiple channels. Here are key ways this data can give you a competitive edge in the Occupational therapists industry.
Geospatial Analysis & Hotspot Detection
Perform advanced spatial analysis to identify business clusters, service gaps, and market saturation patterns across 16 states in Australia using precise coordinate data from 3,126 Occupational therapists.
Market Research & Competitive Analysis
Analyze trends, saturation, and competitor presence across 16 states in Australia to uncover underserved areas and high-potential markets for Occupational therapists.
Lead Generation & Sales Prospecting
Find and reach Occupational therapists in Australia using verified phone numbers, websites, and category filters for smarter, targeted prospecting.
Location Intelligence & Expansion Planning
Plan new Occupational therapists openings or rollouts using density maps and insights from our 3,126 listings to target low-competition, high-demand zones in Australia.
AI & NLP Model Training
Train machine learning models with structured data and real user reviews from 3,126 Occupational therapists for improved sentiment analysis and recommendation systems.
Real Estate & Investment Insights
Evaluate commercial potential in Australia by analyzing the distribution of Occupational therapists across 50 cities and their activity trends.
Email Marketing Campaigns
Run targeted email campaigns to Occupational therapists in Australia using verified email addresses for personalized outreach and improved conversion rates.
Cold Calling & Telemarketing
Use up-to-date phone numbers from our 3,126 Occupational therapists database to initiate effective conversations and improve call conversion rates.
Direct Mail Marketing
Send promotional materials to Occupational therapists across Australia using accurate mailing addresses for targeted delivery and higher response rates.
Social Media Outreach
Engage Occupational therapists in Australia via Instagram, LinkedIn, or Facebook using curated profile data for multi-channel marketing.
Footfall & Demand Estimation
Estimate local foot traffic and demand by analyzing the concentration of Occupational therapists in specific regions of Australia and their popularity metrics.
Local SEO & Digital Services
Optimize marketing strategies for Occupational therapists by studying GMB listings, ratings, and categories used by top-performing competitors in Australia.
Mapping & Navigation Integration
Add Occupational therapists POI data to your apps for delivery, logistics, or travel using accurate coordinates from 3,126 verified locations in Australia.
Related Categories in Australia
Explore related categories in Australia
Occupational therapist in Other Countries
Explore Occupational therapists data across major markets worldwide
How can I download a list of Occupational therapists in Australia into Excel?
You can download the complete list of 3,126 Occupational therapists data as an Excel file, along with geo-coded addresses, phone numbers and open hours by contacting our sales team.