How many Food processing equipments are there in Australia?
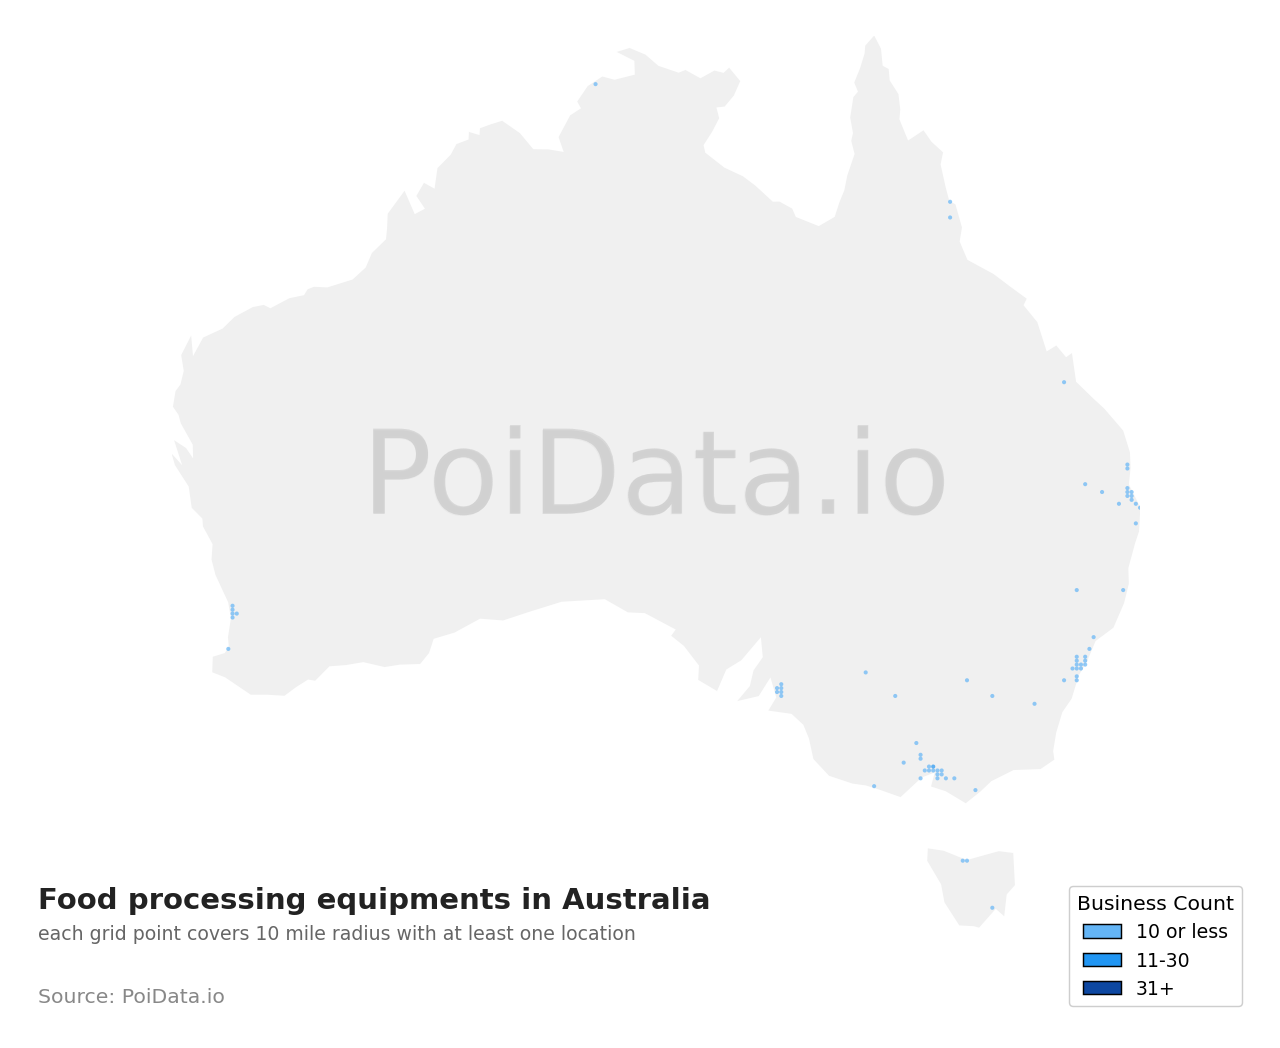
There are 149 Food processing equipments in Australia as of May, 2026. The highest number of Food processing equipments of Australia are in Victoria and New South Wales with 57 businesses and 35 businesses, respectively. Victoria makes up approximately 38.3% of all Food processing equipments in the Australia.
Sample Data
Preview of Food processing equipment businesses in Australia
| Business Name | City | Rating | Reviews | Phone | Website | Latitude | Longitude |
|---|---|---|---|---|---|---|---|
|
Handy Imports Cateri...
|
Smithfield
|
★
4.0
|
358
|
Not available | handyimports.com.au |
**.****
|
**.****
|
|
The Artisan's Botteg...
|
Epping
|
★
4.0
|
170
|
(*3) *4*2 *7*1 | artisansbottega.com.... |
**.****
|
**.****
|
|
Commercial Dehydrato...
|
Carrara
|
★
4.0
|
152
|
(*7) *1*4 *3*5 | commercialdehydrator... |
**.****
|
**.****
|
|
The Artisan's Botteg...
|
Laverton North
|
★
4.0
|
101
|
(*3) *4*2 *7*1 | artisansbottega.com.... |
**.****
|
**.****
|
|
Raw Blend
|
Seventeen Mile Rocks
|
★
4.0
|
92
|
(*7) *3*6 *6*0 | rawblend.com.au |
**.****
|
**.****
|
|
Costante Imports
|
Preston
|
★
4.0
|
83
|
(*3) *4*4 *9*8 | costanteimports.com.... |
**.****
|
**.****
|
|
Butchers Paradise
|
Smithfield
|
★
4.0
|
76
|
*4*2 *1* 9*9 | butchersparadise.com... |
**.****
|
**.****
|
|
Sunwide Australia
|
Clayton South
|
★
4.0
|
70
|
*4*1 *8* 7*7 | sunwide.com.au |
**.****
|
**.****
|
|
Bee Sustainable
|
Brunswick East
|
★
4.0
|
62
|
(*3) *9*9 *3*1 | beesustained.com.au |
**.****
|
**.****
|
|
Vanrooy Machinery
|
Dandenong South
|
★
4.0
|
61
|
(*3) *7*8 *3*0 | vanrooy.com.au |
**.****
|
**.****
|
Get access to all 139 remaining Food processing equipments with complete contact information, addresses, and business details.
Get Complete List (149 Businesses)Top States
Highest concentration of Food processing equipments
| State | Business Count | Percentage |
|---|---|---|
| Victoria |
57
|
38.3%
|
| New South Wales |
35
|
23.5%
|
| Queensland |
21
|
14.1%
|
| Western Australia |
8
|
5.4%
|
| South Australia |
8
|
5.4%
|
| Tasmania |
3
|
2%
|
| VIC |
3
|
2%
|
| NSW |
1
|
0.7%
|
| Australian Capital Territory |
1
|
0.7%
|
Top Cities
Cities with most Food processing equipments
| City | Business Count | Percentage |
|---|---|---|
|
Thomastown
|
8
|
5.4%
|
|
Epping
|
4
|
2.7%
|
|
Piangil
|
3
|
2%
|
|
Dandenong South
|
3
|
2%
|
|
Preston
|
3
|
2%
|
|
Northmead
|
2
|
1.3%
|
|
Seven Hills
|
2
|
1.3%
|
|
Smithfield
|
2
|
1.3%
|
|
Wetherill Park
|
2
|
1.3%
|
|
Breakwater
|
2
|
1.3%
|
|
Coburg North
|
2
|
1.3%
|
|
Truganina
|
2
|
1.3%
|
|
Canning Vale
|
2
|
1.3%
|
|
Fyshwick
|
1
|
0.7%
|
|
Milperra
|
1
|
0.7%
|
|
Argenton
|
1
|
0.7%
|
|
Banksmeadow
|
1
|
0.7%
|
|
Bankstown
|
1
|
0.7%
|
|
Berkeley Vale
|
1
|
0.7%
|
|
Bowral
|
1
|
0.7%
|
|
Brookvale
|
1
|
0.7%
|
|
Campbelltown
|
1
|
0.7%
|
|
Cardiff
|
1
|
0.7%
|
|
Castle Hill
|
1
|
0.7%
|
|
Condell Park
|
1
|
0.7%
|
|
Eltham
|
1
|
0.7%
|
|
Frenchs Forest
|
1
|
0.7%
|
|
Ingleburn
|
1
|
0.7%
|
|
Leeton
|
1
|
0.7%
|
|
Maroubra
|
1
|
0.7%
|
|
Merrylands
|
1
|
0.7%
|
|
Mosman
|
1
|
0.7%
|
|
North Sydney
|
1
|
0.7%
|
|
Regents Park
|
1
|
0.7%
|
|
Rosebery
|
1
|
0.7%
|
|
Rouse Hill
|
1
|
0.7%
|
|
Sydney Olympic Park
|
1
|
0.7%
|
|
Tamworth
|
1
|
0.7%
|
|
Unanderra
|
1
|
0.7%
|
|
Wagga Wagga
|
1
|
0.7%
|
|
Warriewood
|
1
|
0.7%
|
|
Woonona
|
1
|
0.7%
|
|
Brendale
|
1
|
0.7%
|
|
Browns Plains
|
1
|
0.7%
|
|
Buderim
|
1
|
0.7%
|
|
Carrara
|
1
|
0.7%
|
|
Coolum Beach
|
1
|
0.7%
|
|
Currumbin Waters
|
1
|
0.7%
|
|
Dalby
|
1
|
0.7%
|
|
Eagle Farm
|
1
|
0.7%
|
What Data Do We Provide?
Our list for Food processing equipments in Australia is one of the most comprehensive in the industry. As of June, 2026, we have compiled data on 149 verified listings.
Essential Business Details
Complete business name, full address, and operational hours for all 149 Food processing equipments
Contact Information
Direct phone numbers, email addresses, and website URLs for Food processing equipments across Australia
Customer Engagement Metrics
Average ratings, total review counts, and customer feedback data from Food processing equipments in Australia
Precise Geolocation Data
Exact latitude/longitude coordinates and regional distribution across 9 states in Australia
Complete Data Fields for Food processing equipments in Australia:
Each of the 149 Food processing equipments records includes:
Business Attributes
Common features and services (10+ businesses)
payment methods
services
amenities
accessibility
business type
other
How You Can Use Food processing equipments Data from Australia
Our comprehensive list of 149 Food processing equipments in Australia empowers you to reach the right audience through multiple channels. Here are key ways this data can give you a competitive edge in the Food processing equipments industry.
Geospatial Analysis & Hotspot Detection
Perform advanced spatial analysis to identify business clusters, service gaps, and market saturation patterns across 9 states in Australia using precise coordinate data from 149 Food processing equipments.
Market Research & Competitive Analysis
Analyze trends, saturation, and competitor presence across 9 states in Australia to uncover underserved areas and high-potential markets for Food processing equipments.
Lead Generation & Sales Prospecting
Find and reach Food processing equipments in Australia using verified phone numbers, websites, and category filters for smarter, targeted prospecting.
Location Intelligence & Expansion Planning
Plan new Food processing equipments openings or rollouts using density maps and insights from our 149 listings to target low-competition, high-demand zones in Australia.
AI & NLP Model Training
Train machine learning models with structured data and real user reviews from 149 Food processing equipments for improved sentiment analysis and recommendation systems.
Real Estate & Investment Insights
Evaluate commercial potential in Australia by analyzing the distribution of Food processing equipments across 50 cities and their activity trends.
Email Marketing Campaigns
Run targeted email campaigns to Food processing equipments in Australia using verified email addresses for personalized outreach and improved conversion rates.
Cold Calling & Telemarketing
Use up-to-date phone numbers from our 149 Food processing equipments database to initiate effective conversations and improve call conversion rates.
Direct Mail Marketing
Send promotional materials to Food processing equipments across Australia using accurate mailing addresses for targeted delivery and higher response rates.
Social Media Outreach
Engage Food processing equipments in Australia via Instagram, LinkedIn, or Facebook using curated profile data for multi-channel marketing.
Footfall & Demand Estimation
Estimate local foot traffic and demand by analyzing the concentration of Food processing equipments in specific regions of Australia and their popularity metrics.
Local SEO & Digital Services
Optimize marketing strategies for Food processing equipments by studying GMB listings, ratings, and categories used by top-performing competitors in Australia.
Mapping & Navigation Integration
Add Food processing equipments POI data to your apps for delivery, logistics, or travel using accurate coordinates from 149 verified locations in Australia.
Related Categories in Australia
Explore related categories in Australia
Food processing equipment in Other Countries
Explore Food processing equipments data across major markets worldwide
How can I download a list of Food processing equipments in Australia into Excel?
You can download the complete list of 149 Food processing equipments data as an Excel file, along with geo-coded addresses, phone numbers and open hours by contacting our sales team.