List of Exhibits in South Korea?
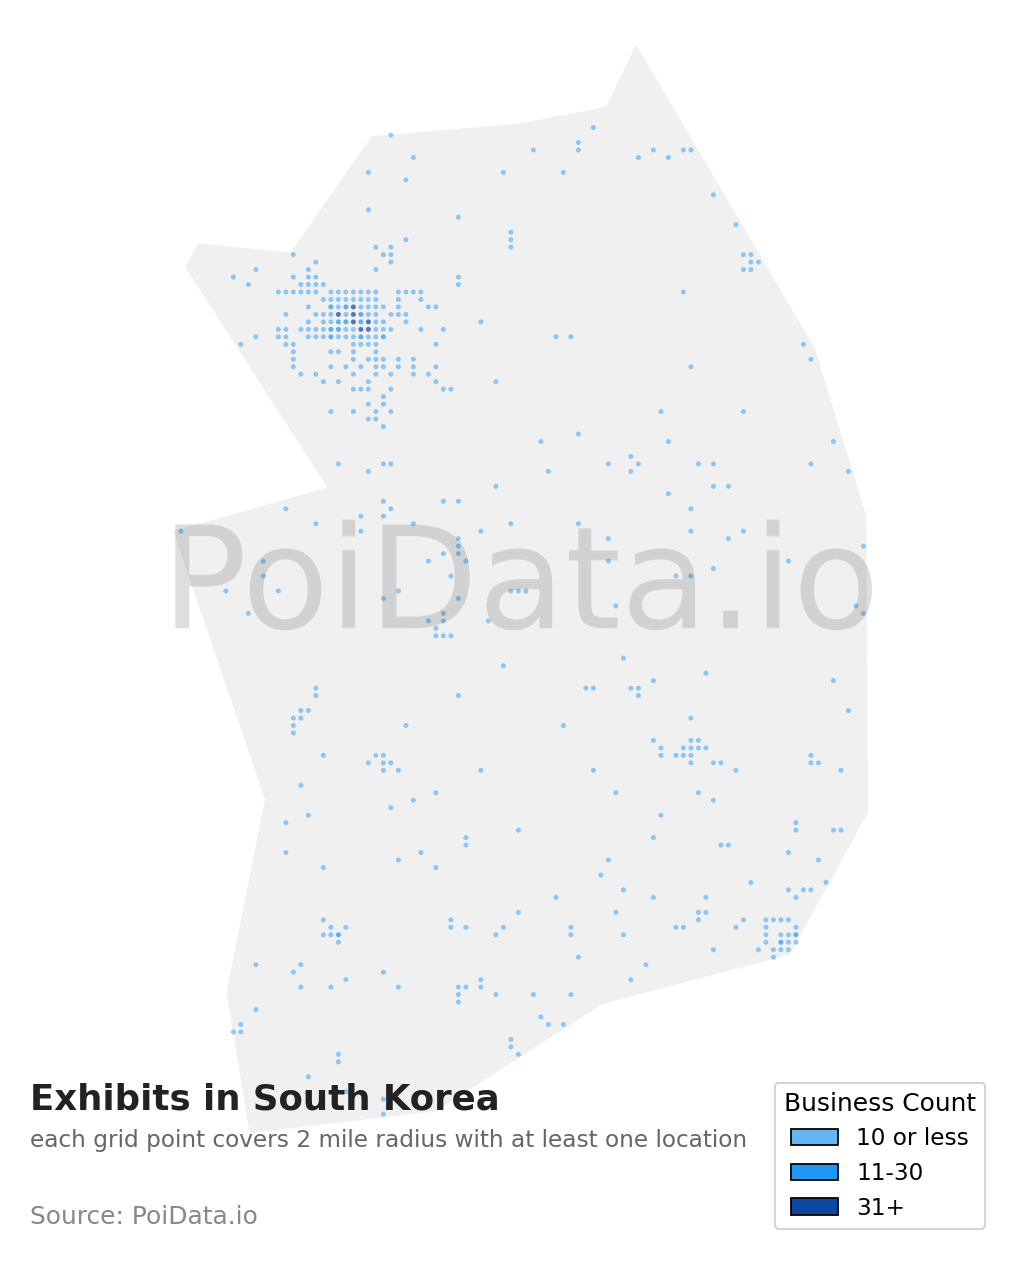
There are 1,311 Exhibits in South Korea as of November, 2025. The highest number of Exhibits of South Korea are in Seoul and Gyeonggi-do with 500 businesses and 125 businesses, respectively. Seoul makes up approximately 38.1% of all Exhibits in the South Korea.
Sample Data
Preview of Exhibit businesses in South Korea
| Business Name | City | Rating | Reviews | Phone | Website | Latitude | Longitude |
|---|---|---|---|---|---|---|---|
|
Bunker des Lumières
|
Seogwipo-si
|
★
4.0
|
6,807
|
*5*2-*6*3 | deslumieres.co.kr |
**.****
|
**.****
|
|
F1963
|
Suyeong-gu
|
★
4.0
|
3,886
|
*5*-7*6-*9*3 | f1963.org |
**.****
|
**.****
|
|
Ilsan Lake Park Goya...
|
Goyang-si
|
★
4.0
|
2,649
|
*3*-9*8-*7*0 | flower.or.kr |
**.****
|
**.****
|
|
P.ARK
|
Yeongdo-gu
|
★
4.0
|
2,645
|
*7*-4*2*-0*1* | p-ark.kr |
**.****
|
**.****
|
|
Nohyung Supermarket
|
Jeju-si
|
★
4.0
|
2,030
|
*6*-7*3-*8*8 | nohyung-supermarket.... |
**.****
|
**.****
|
|
Arte Museum Yeosu
|
Yeosu-si
|
★
4.0
|
1,530
|
*8*9-*0*8 | kr.artemuseum.com |
**.****
|
**.****
|
|
Alive Museum, Insado...
|
Jongno District
|
★
4.0
|
1,285
|
*2-*0*4-*6*0 | klook.com |
**.****
|
**.****
|
|
Seoul Animation Cent...
|
Jung District
|
★
4.0
|
1,282
|
*2-*4*5-*3*1 | ani.seoul.kr |
**.****
|
**.****
|
|
Ayang Art Center
|
Dong-gu
|
★
4.0
|
1,182
|
*5*-2*0-*3*0 | ayangarts.or.kr |
**.****
|
**.****
|
|
Culture Station Seou...
|
Jung District
|
★
4.0
|
1,018
|
*2-*4*7-*5*0 | seoul284.org |
**.****
|
**.****
|
Get access to all 1,301 remaining Exhibits with complete contact information, addresses, and business details.
Get Complete List (1,311 Businesses)Top States
Highest concentration of Exhibits
| State | Business Count | Percentage |
|---|---|---|
| Seoul |
500
|
38.1%
|
| Gyeonggi-do |
125
|
9.5%
|
| Busan |
68
|
5.2%
|
| Gyeongsangnam-do |
43
|
3.3%
|
| Gyeongsangbuk-do |
41
|
3.1%
|
| Jeollanam-do |
38
|
2.9%
|
| Gangwon-do |
37
|
2.8%
|
| Jeju-do |
37
|
2.8%
|
| Jeonbuk State |
28
|
2.1%
|
| Chungcheongnam-do |
26
|
2%
|
| Daegu |
24
|
1.8%
|
| Gwangju |
23
|
1.8%
|
| Incheon |
21
|
1.6%
|
| Chungcheongbuk-do |
20
|
1.5%
|
| Daejeon |
11
|
0.8%
|
| Ulsan |
8
|
0.6%
|
| 대구광역시 |
1
|
0.1%
|
Top Cities
Cities with most Exhibits
| City | Business Count | Percentage |
|---|---|---|
|
Gangnam District
|
86
|
6.6%
|
|
Jongno District
|
75
|
5.7%
|
|
Mapo-gu
|
64
|
4.9%
|
|
Seongdong-gu
|
41
|
3.1%
|
|
Jung District
|
38
|
2.9%
|
|
Yongsan District
|
31
|
2.4%
|
|
Seocho District
|
26
|
2%
|
|
Yeongdeungpo District
|
25
|
1.9%
|
|
Jeju-si
|
22
|
1.7%
|
|
Goyang-si
|
20
|
1.5%
|
|
Haeundae-gu
|
17
|
1.3%
|
|
Seogwipo-si
|
15
|
1.1%
|
|
Jeonju-si
|
14
|
1.1%
|
|
Paju-si
|
12
|
0.9%
|
|
Seongbuk District
|
12
|
0.9%
|
|
Songpa District
|
11
|
0.8%
|
|
Gangneung-si
|
10
|
0.8%
|
|
Seongnam-si
|
10
|
0.8%
|
|
Dong-gu
|
9
|
0.7%
|
|
Seodaemun-gu
|
9
|
0.7%
|
|
Dong-gu
|
8
|
0.6%
|
|
Namhae-gun
|
8
|
0.6%
|
|
Jung-gu
|
8
|
0.6%
|
|
Gijang-gun
|
7
|
0.5%
|
|
Suyeong-gu
|
7
|
0.5%
|
|
Bucheon-si
|
7
|
0.5%
|
|
Suwon-si
|
7
|
0.5%
|
|
Gyeongju-si
|
7
|
0.5%
|
|
Changwon-si
|
7
|
0.5%
|
|
Cheongju-si
|
6
|
0.5%
|
|
Cheonan-si
|
6
|
0.5%
|
|
Buk-gu
|
6
|
0.5%
|
|
Gwangju-si
|
6
|
0.5%
|
|
Namyangju-si
|
6
|
0.5%
|
|
Yongin-si
|
6
|
0.5%
|
|
Seocheon-gun
|
5
|
0.4%
|
|
Seo-gu
|
5
|
0.4%
|
|
Ansan-si
|
5
|
0.4%
|
|
Gimpo-si
|
5
|
0.4%
|
|
Pocheon-si
|
5
|
0.4%
|
|
Uiwang-si
|
5
|
0.4%
|
|
Andong-si
|
5
|
0.4%
|
|
Gumi-si
|
5
|
0.4%
|
|
Suncheon-si
|
5
|
0.4%
|
|
Yeosu-si
|
5
|
0.4%
|
|
Gunsan-si
|
4
|
0.3%
|
|
Jeju-si
|
4
|
0.3%
|
|
Busanjin District
|
4
|
0.3%
|
|
Sasang-gu
|
4
|
0.3%
|
|
Dangjin-si
|
4
|
0.3%
|
What Data Do We Provide?
Our list for Exhibits in South Korea is one of the most comprehensive in the industry. As of December, 2025, we have compiled data on 1,311 verified listings.
Essential Business Details
Complete business name, full address, and operational hours for all 1,311 Exhibits
Contact Information
Direct phone numbers, email addresses, and website URLs for Exhibits across South Korea
Customer Engagement Metrics
Average ratings, total review counts, and customer feedback data from Exhibits in South Korea
Precise Geolocation Data
Exact latitude/longitude coordinates and regional distribution across 17 states in South Korea
Complete Data Fields for Exhibits in South Korea:
Each of the 1,311 Exhibits records includes:
Business Attributes
Common features and services (10+ businesses)
payment methods
services
amenities
accessibility
business type
other
How You Can Use Exhibits Data from South Korea
Our comprehensive list of 1,311 Exhibits in South Korea empowers you to reach the right audience through multiple channels. Here are key ways this data can give you a competitive edge in the Exhibits industry.
Geospatial Analysis & Hotspot Detection
Perform advanced spatial analysis to identify business clusters, service gaps, and market saturation patterns across 17 states in South Korea using precise coordinate data from 1,311 Exhibits.
Market Research & Competitive Analysis
Analyze trends, saturation, and competitor presence across 17 states in South Korea to uncover underserved areas and high-potential markets for Exhibits.
Lead Generation & Sales Prospecting
Find and reach Exhibits in South Korea using verified phone numbers, websites, and category filters for smarter, targeted prospecting.
Location Intelligence & Expansion Planning
Plan new Exhibits openings or rollouts using density maps and insights from our 1,311 listings to target low-competition, high-demand zones in South Korea.
AI & NLP Model Training
Train machine learning models with structured data and real user reviews from 1,311 Exhibits for improved sentiment analysis and recommendation systems.
Real Estate & Investment Insights
Evaluate commercial potential in South Korea by analyzing the distribution of Exhibits across 50 cities and their activity trends.
Email Marketing Campaigns
Run targeted email campaigns to Exhibits in South Korea using verified email addresses for personalized outreach and improved conversion rates.
Cold Calling & Telemarketing
Use up-to-date phone numbers from our 1,311 Exhibits database to initiate effective conversations and improve call conversion rates.
Direct Mail Marketing
Send promotional materials to Exhibits across South Korea using accurate mailing addresses for targeted delivery and higher response rates.
Social Media Outreach
Engage Exhibits in South Korea via Instagram, LinkedIn, or Facebook using curated profile data for multi-channel marketing.
Footfall & Demand Estimation
Estimate local foot traffic and demand by analyzing the concentration of Exhibits in specific regions of South Korea and their popularity metrics.
Local SEO & Digital Services
Optimize marketing strategies for Exhibits by studying GMB listings, ratings, and categories used by top-performing competitors in South Korea.
Mapping & Navigation Integration
Add Exhibits POI data to your apps for delivery, logistics, or travel using accurate coordinates from 1,311 verified locations in South Korea.
Related Categories in South Korea
Explore related categories in South Korea
Exhibit in Other Countries
Explore Exhibits data across major markets worldwide
How can I download a list of Exhibits in South Korea into Excel?
You can download the complete list of 1,311 Exhibits data as an Excel file, along with geo-coded addresses, phone numbers and open hours by contacting our sales team.